
The Traffic Cop: Load Balancing, Explained Like You're New
Blueprints of Scale — Core Concepts #11
In the URL shortener post, Step 3 drew a box labeled "Load Balancer" between the users and the API servers and then never said another word about it. It sat there doing the most important job in the diagram while the text hurried on to the database. This post is that box.
The problem it solves is easy to state. The moment you have more than one server, someone has to decide which server gets each request. One server melts under real traffic (Step 0 covered that). Three servers share the load nicely, but only if the sharing is somebody's job, and it turns out clients can't do it fairly and DNS can't do it intelligently. So you put a dedicated machine at the front door whose only job is to distribute. That's the load balancer, and it's one of the oldest ideas in distributed systems. It's also one of the least understood, because it looks trivial right up until the day it decides whether your outage is one server or all of them.
We'll cover why one server is never enough and what replaces it; the distribution algorithms (round-robin, least connections, IP hash, power of two choices, consistent hashing); the Layer 4 versus Layer 7 split and the things that come with it, like who the backend thinks it's talking to and where TLS gets decrypted; health checks, the trap inside "deep" health checks, and graceful draining; sticky sessions and why you should try not to need them; what happens when the balancer itself dies; the ways a balancer can make an outage worse; the balancer as the place you deploy from and shed load at; and, at the end, the deeper toolkit: latency-aware routing, client-side balancing, service meshes, subsetting, and how to size the tier itself.
If you're new to this, Sections 1 and 2 need nothing but curiosity. Sections 3 through 8 are the machinery you'll actually operate. Section 9 is for when you're the one who has to size the thing and defend the design. There's a one-page summary at the end under The traffic cop, distilled, and every diagram is also described in the text around it.
Section 1 — One box isn't enough
Saturday, 2 PM. A small API on a single server, doing fine at 200 requests a second. Then a newsletter goes out, traffic goes up tenfold in an hour, and the server does the only thing an overloaded server can do: it gets slower, then slower, then it stops answering. The first fix anyone reaches for is a bigger server. It works, for three months. Then the newsletter goes out again.
The sharding post (#3) covered the economics: doubling a server's power more than doubles its price, and at some point the bigger box doesn't exist. The durable fix is horizontal. Run three servers instead of one, then ten, then fifty. But now the client has to pick a server, and clients are bad at it.
Hand a client three IP addresses and watch what happens. Some clients take the first one and never try the others. DNS round-robin rotates the list, but DNS answers get cached by the client's operating system, by the ISP's resolver, by everything in between, so the rotation is more of a suggestion than a mechanism (each answer carries a TTL, a time to live, and nothing forces a client to re-ask before it expires). One server ends up with 70% of the traffic while the other two idle. And when a server dies, nothing tells the clients. They keep sending requests to the dead address until a human edits DNS and then waits for every cache in the world to expire. (To be fair to DNS: a health-checked, low-TTL DNS service like Route 53 is a legitimate tool for steering traffic between whole regions, and Section 6 comes back to it. It's just the wrong tool for picking between servers a millisecond apart.)
So you put one stable address in front and a dedicated box behind it. Clients talk to the address; the box, the load balancer, talks to the servers. It knows all three of them (or all thirty), it knows which ones are alive, and for every incoming request it picks one. From the client's side there's a single endpoint that never gets tired. From the servers' side the work arrives evenly split.
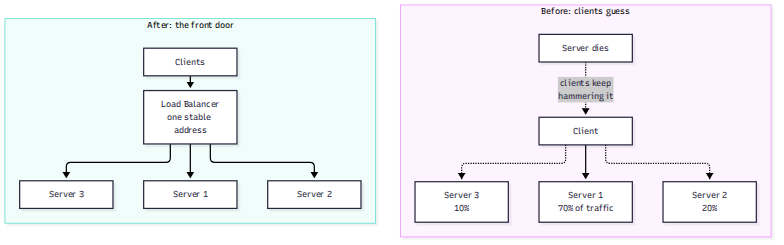
That's the idea in one line: one address in, N servers behind it, and the distribution is someone's job. The job has three parts, and they're the next three sections: deciding which server gets each request, knowing which servers are alive, and understanding enough of the request to decide well. Everything after that is what happens when the balancer decides badly, can't see, or dies.
A quick map of what "a load balancer" can physically be, because the vocabulary trips people up. It can be a hardware appliance (F5 BIG-IP, NetScaler, the boxes with the big price tags), a piece of software on an ordinary machine (HAProxy, NGINX, Envoy, Traefik), a cloud-managed service (AWS ALB and NLB, Google Cloud Load Balancing, Azure Load Balancer and Application Gateway), or something living inside a cluster (Kubernetes Services via kube-proxy or IPVS, Ingress controllers, the Gateway API). They all do the job this post describes. The words differ by vendor: the set of servers behind a balancer is a pool, an upstream, a target group, or a backend service depending on whose documentation you're reading, and they all mean the same thing.
Section 2 — The doorman's playbook
A load balancer makes one decision, over and over, millions of times a second: this request goes to that server. There are half a dozen standard ways to make it, and each one is a different guess about what "fair" means for your traffic.
Round-robin is the default in nearly every product: request 1 to server A, 2 to B, 3 to C, 4 back to A. No memory, no state, nothing to tune. It's fair as long as every request costs about the same, which they never do. One request is a 2 ms cache lookup and the next is a 900 ms report. Round-robin deals them out evenly and the servers end up unevenly loaded anyway, the same way dealing cards evenly says nothing about who got the aces.
Weighted round-robin fixes one specific unfairness, which is that the servers aren't identical. The new 64-core box gets weight 4, the old 16-core box gets weight 1, and the rotation sends four requests to the big one for every one to the small one. It's simple and static, and it's wrong the moment the weights stop matching reality. Section 7 has more to say about that.
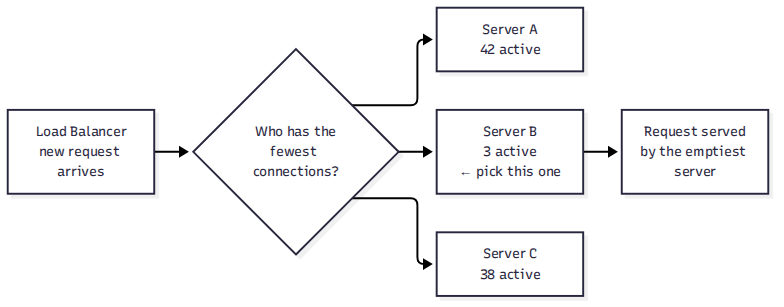
Least connections stops counting requests and starts looking at the servers. Each new request goes to whichever server has the fewest active connections. The one still chewing on the 900 ms report has 40 connections open; the one that's idle has 3; the next request goes to the idle one. For uneven work (long-lived connections, websockets, a mix of cheap and expensive endpoints) it's usually the right default, and it's what I'd start with unless I had a specific reason not to. One caveat for later: when you have many balancers in front of the same fleet, each with its own view of connection counts, they can all pick the same "emptiest" server at the same moment and pile onto it. Section 9 has the fix.
Least response time goes a step further. The balancer tracks how slow each server has been recently, usually as an exponentially weighted moving average (EWMA: a running average that counts the last few seconds more heavily than the last few minutes), and prefers the fast ones. This catches the server that's alive but struggling: the one stuck in garbage-collection pauses (when a managed runtime like the JVM stops the world to reclaim memory), or sharing a physical host with a "noisy neighbor" that's eating the CPU. The risk is a feedback loop: the fast server gets more traffic because it's fast, until it isn't. It needs damping or it oscillates.
IP hash is the cheap way to get stickiness: hash the client's IP, take hash(ip) mod N, and the same client always lands on the same server. No cookies and no state in the balancer. It has two problems. Adding one server reshuffles the modulo for everyone (the sharding post solved that exact problem with consistent hashing, and most balancers offer it as a mode). And an IP is not a person: behind a mobile carrier's or a corporate network's NAT (network address translation, which hides many devices behind one public address), one address can be thousands of users, and all of them land on the same server.
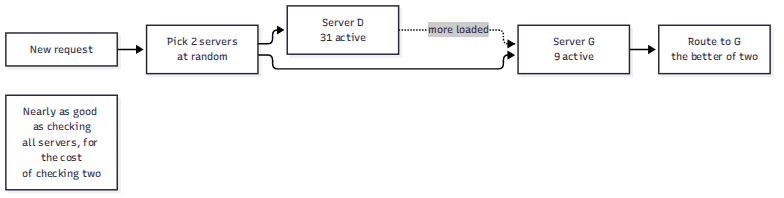
Power of two choices is my favorite, because it seems too simple to work. Pick two servers at random and send the request to the less loaded of the pair. Michael Mitzenmacher's analysis (his 1996 thesis, published in IEEE TPDS in 2001, building on Azar, Broder, Karlin and Upfal's 1994 balls-in-bins result) showed this gives you exponentially better balance than picking one at random, close to what you'd get from checking every server, for the cost of checking two. It's the algorithm for when you want least-connections behavior without the balancer having to keep a global, always-accurate picture of every server's load. HAProxy's balance random does two draws by default for exactly this reason.
| Algorithm | Decides by | Good when | Watch out for |
|---|---|---|---|
| Round-robin | Rotation | Requests are uniform and cheap | Uneven work lands unevenly |
| Weighted round-robin | Rotation × capacity | Servers differ in size | Weights go stale; reality drifts |
| Least connections | Active connections | Work is uneven, connections are long | Many balancers can herd onto the same server |
| Least response time | Recent latency (EWMA) | Servers degrade gradually, not just die | Feedback loop: fast gets faster until it doesn't |
| IP hash | Client IP | You need cheap stickiness | Rescaling reshuffles everyone; NAT makes one IP thousands of users |
| Power of two choices | Best of 2 random | You want balance without global state | Slightly less precise than full least-connections |
| Consistent hashing | Hash ring | The server's state matters (caches) | Uneven ring without virtual nodes |
The last row needs a sentence. When each server holds its own cache of hot data, you want the same request to hit the same server every time; otherwise every server ends up caching everything and the hit ratio collapses. Consistent hashing (the ring and virtual nodes from the sharding post) gives you that affinity and keeps most of it intact when servers come and go. The CDN post (#7) used it at the edge for the same reason.
The failure I've seen most often here is round-robin in front of a mixed workload: 2 ms lookups and 30-second file conversions sharing one fleet. The conversions land wherever the rotation happens to put them, those servers build up minutes of queue, and the cheap lookups get stuck behind them. Switching to least connections fixes it in an afternoon. The algorithm is a bet about your workload, so bet on what your traffic actually looks like rather than on whatever the default was.
Section 3 — Does the doorman read the letter?
Everything in Section 2 assumed the balancer picks from one pool of interchangeable servers. The next question is how much of the request the balancer can actually see, and the answer splits balancers into two families. The names come from the OSI networking model, where layer 4 is the transport layer (TCP and UDP: addresses and ports) and layer 7 is the application layer (HTTP: URLs, headers, cookies).
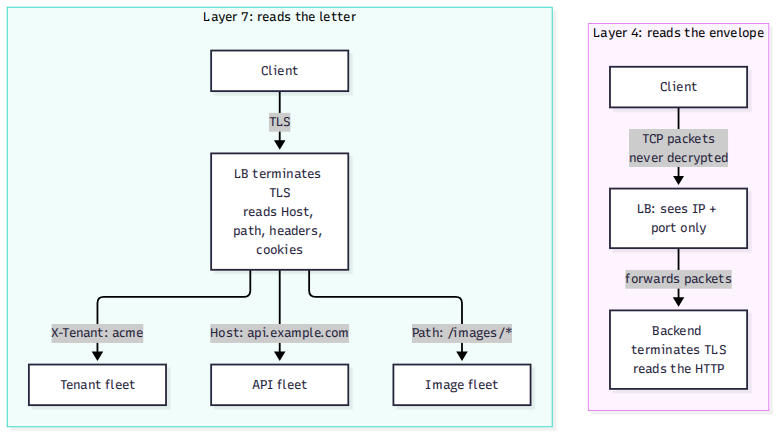
A Layer 4 balancer reads the envelope: source IP, destination IP, port. It never looks inside. A TCP connection arrives, the balancer picks a backend, and the packets go through; the backend terminates the connection, does the TLS handshake, and reads the HTTP. Because it never opens the letter, an L4 balancer is fast, cheap, and indifferent to protocol. It balances HTTP, websockets, raw TCP, your custom binary protocol, whatever you have. It also can't make decisions based on what's in the letter. It can't send /api to one fleet and /static to another, because it never sees the URL. (It can route by port, and a TLS-aware L4 balancer can peek at the server name in the handshake, but that's about the limit.)
A Layer 7 balancer reads the letter. It terminates the TCP connection and the TLS session itself, parses the HTTP request, and routes on anything inside it: the Host header (api. to the API fleet, www. to the web fleet), the path (/images to the image servers), a custom header (X-Tenant: acme to that tenant's fleet), a cookie (that's stickiness, Section 5). Then it opens a new connection to the backend it chose. This is where routing gets expressive, and where the costs come from.
The trade:
- L4 is faster and cheaper per request. No decryption, no HTTP parsing, a smaller CPU bill, and it works for anything on TCP or UDP. But it's limited to routing by address and port, with no content routing, no cookie stickiness, and no header-based canaries.
- L7 is smarter and heavier. It terminates TLS (CPU cost, plus the certificates now live on the balancer), parses every request, and adds a small hop of latency. In exchange you get path, host, and header routing, cookie affinity, request rewriting, per-route policies, and a place to hang a web application firewall (a WAF, which inspects requests for known attack patterns before they reach your code).
The rule of thumb: L4 when the backends are interchangeable or the protocol isn't HTTP; L7 when routing depends on what's in the request. Most real systems run both, with a cheap L4 tier at the very edge spreading traffic across a fleet of L7 balancers that do the clever part. The CDN post's edge is layered the same way, TCP at the bottom and HTTP intelligence on top.
Now three things that fall out of this split and cause more tickets than the algorithms in Section 2 ever will.
How the packets actually get to the backend. There are three shapes. A full proxy terminates the client's connection and opens a second one to the backend; every L7 balancer is a full proxy, and so are HAProxy's and NGINX's TCP modes. A NAT balancer rewrites the destination address on each inbound packet and rewrites the source on the way back, so both directions flow through it. And direct server return (DSR, sometimes done with tunneling) has the balancer touch only the inbound packets: the backend answers the client directly, and the response never passes through the balancer at all. DSR is what you want when responses are far bigger than requests, which is most of the web, because the balancer only has to carry the small half. It's how the big stateless L4 tiers in Section 6 work. The point for now is that "Layer 4" covers all three, and which one you're running changes what the backend sees.
Who the backend thinks it's talking to. With a full proxy, every connection arriving at a backend comes from the balancer's IP. Your access logs show one address. Your per-IP rate limits (post #8) throttle the balancer. Your geo-lookup says everyone is in the same rack. The fix at L7 is a header: the balancer appends the real client address to X-Forwarded-For (or the standardized Forwarded header from RFC 7239). At L4, where there are no headers to add, the PROXY protocol prepends a small line with the original addresses to the start of the TCP stream, and the backend has to be configured to expect it. One rule to tattoo somewhere: trust only the address your own balancer appended. X-Forwarded-For is a plain header that any client can send with any value, and a rate limiter that believes the first entry is a rate limiter an attacker can point at somebody else. The security post (#12) comes back to this.
Where TLS ends. An L7 balancer holds your private keys and decrypts every request, which means decrypted traffic now travels your internal network. That's a security boundary and a compliance question, and it's the kind of thing to raise in the design review rather than discover in an audit. You have three options. Termination: decrypt at the balancer, plaintext to the backends; simplest, fine inside a trusted network. Re-encryption: decrypt at the balancer to route, then open a fresh TLS connection to the backend; this is what service meshes do, often with both sides presenting certificates. Passthrough: never decrypt; the balancer reads only the server name from the TLS handshake (SNI) to pick a pool, and the backend holds the keys. Passthrough keeps keys off the balancer but gives up everything in the L7 column. Two operational notes for whichever you pick: certificate renewal should be automated (ACME, the protocol behind Let's Encrypt), because expired certificates are an outage class of their own, and TLS session resumption at the balancer is what keeps the handshake CPU cost affordable.
One more, because it surprises people who've moved to HTTP/2 or gRPC. HTTP/2 multiplexes many requests over one long-lived TCP connection. A connection-level balancer (L4, or an L7 balancer that isn't HTTP/2-aware on the backend side) picks a backend once, when the connection opens, and every request on that connection goes to the same place for as long as it lives. Balance that looks perfect by connection count can be terrible by request count, and a new backend added to the pool gets nothing until clients open new connections. The fixes are to balance per request at L7, to have backends set a maximum connection age and send a GOAWAY (HTTP/2's polite "please reconnect" frame) so clients reconnect and re-spread, or to balance on the client side (Section 9). HTTP/3 over QUIC (the newer transport that runs over UDP) has its own version of this: a QUIC connection can survive the client changing IP addresses, so an L4 balancer has to route by the QUIC connection ID rather than the address tuple, or migrations break.
Section 4 — Dead servers and graceful goodbyes
A deploy rolls out and server 7's new binary has a bug: it accepts connections and then hangs. The balancer keeps sending it a third of the traffic, because as far as the balancer can tell, server 7 is fine. The TCP handshake succeeds. Users start timing out. The deploy dashboard says success. The service is down.
The balancer only knows what it checks, and health checks are how it checks. There are two kinds.
Active checks are the balancer probing on its own schedule: every few seconds it sends each server a request, typically an HTTP GET to /health, and after some number of consecutive failures the server is pulled from the pool. The defaults vary more than you'd expect. HAProxy probes every 2 seconds and ejects after 3 failures; Google's cloud balancer every 5 seconds, 2 failures; AWS's ALB every 30 seconds, 2 failures; Kubernetes every 10 seconds, 3 failures. None of those numbers is magic. The interval sets how long a dead server keeps receiving traffic before anyone notices, and the failure count sets how much noise you tolerate before acting.
Passive checks are the balancer watching real traffic. A backend starts timing out, returning 500s, resetting connections; the balancer notices without sending a single probe and pulls it. Passive checking costs nothing extra and reacts to actual user pain, but by definition it only fires after someone has already felt that pain. (Open-source NGINX only does passive checks, and its default of max_fails=1 means one failed connection or timeout ejects a server for ten seconds (HTTP 5xx responses count only if you list them in proxy_next_upstream). Worth knowing before you wonder why servers keep blinking out of the pool.)
The interval matters less than two other things: what the probe actually tests, and how the thresholds are shaped.
What the probe tests, and the trap on both sides. The shallow failure is obvious: /health returns 200 because the web server process is up, while the database connection pool behind it is exhausted and every real request fails. A check that doesn't exercise anything is a lie you tell the balancer. So the instinct is to make the check deep: hit the database, hit the cache, exercise the real request path. And that instinct has a trap of its own, which is easy to miss until it takes down a fleet. If every server's health check touches the same shared database, and that database blips for five seconds, every server fails its check at the same moment. The balancer, doing exactly what it was told, ejects all of them. A five-second database hiccup that the servers could have ridden out (serving cached data, returning degraded responses, or just retrying) becomes a total outage, followed by every server rejoining at once when the database recovers. A dependency check that fails identically on every server isn't telling the balancer which server to avoid; it's telling it the whole system is sick, and that's an alert (post #9), not a routing decision.
The advice that survives both traps: the health check should verify this server's ability to do its job, meaning the things that differ between servers, like its own connection pool, its own disk, its own configuration, and whether it finished starting up. Shared-dependency status belongs in a separate "degraded" signal that gets reported but doesn't fail the check. And the balancer needs a fail-open rule for the case where everything looks unhealthy anyway: Envoy calls this the panic threshold, and by default, if fewer than 50% of a pool's hosts are healthy, it ignores health entirely and sends to all of them, on the theory that a fleet that's all "unhealthy" is more likely a broken check or a shared dependency than a fleet that's all dead. Amazon's Builders' Library article on health checks is the best long-form treatment of this balance I know of.
If you run on Kubernetes, the same idea comes packaged as two probes with different consequences. A liveness probe failing means "restart this container." A readiness probe failing means "stop sending this pod traffic, but leave it running." The balancer consumes readiness. Confusing them is common and expensive: a liveness probe that checks the database restarts every pod in a crash loop when the database is down, which is the fleet-wide trap above with extra steps. There's a startup probe for slow-booting services so liveness doesn't kill them mid-boot, and there's a race at shutdown worth knowing: a pod can receive its termination signal before the endpoint removal has propagated to every proxy, so requests still arrive at a container that's already exiting. The standard workaround is a preStop hook that sleeps a few seconds before the process gets its signal.
Flapping and hysteresis. A server that oscillates (fail, pass, fail, pass) gets yanked in and out of the pool, and every yank reshuffles connections onto the survivors. The fix is hysteresis: different bars for leaving and rejoining. Three failures to get pulled; ten consecutive clean probes, or a full minute of them, to get back in. Leaving is easy, returning has to be earned. Note that several products' defaults do the opposite (HAProxy needs 3 failures to eject and only 2 successes to rejoin; Kubernetes 3 and 1), while AWS's ALB (2 to eject, 5 to rejoin) gets it right, so this is a setting you make deliberately. And once a server is back, ramp its traffic up gradually rather than handing it the full share at once. That's slow start, in Section 7.
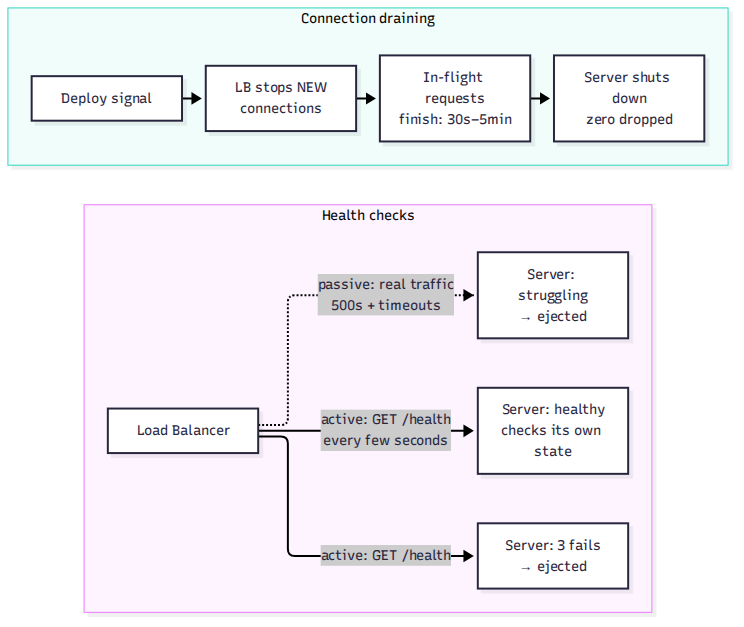
Then there's the planned version of death. Every deploy, every scale-down, every machine retirement takes a server out of the pool on purpose, and the civilized way to do it is connection draining: the balancer stops sending new requests to the retiring server, waits for the in-flight ones to finish, and only then lets it shut down. The waiting period is a setting: Kubernetes gives a pod 30 seconds by default, and AWS's ALB waits 300 seconds by default (its "deregistration delay"). Skip the draining and every deploy drops whatever was mid-request. That's the little spike of 500s that shows up in deploy dashboards, which teams first learn to recognize and then, eventually, learn to stop tolerating.
Draining has details that bite. For HTTP/1.1 keep-alive connections, the server should answer with Connection: close so the client reconnects elsewhere. For HTTP/2 it sends GOAWAY. A websocket never "finishes" on its own, so a drain needs a deadline after which the server closes the connection deliberately and the client has to know how to reconnect, ideally with some random jitter so ten thousand reconnects don't land in the same second. And the application has to handle its termination signal (SIGTERM) by finishing work rather than exiting immediately, or the balancer's patience is wasted.
Two more items that live here and generate a remarkable number of tickets:
- Timeout mismatch and the intermittent 502. An L7 balancer keeps a pool of idle connections to each backend and reuses them. If the backend's keep-alive timeout is shorter than the balancer's idle timeout, the backend closes an idle connection at the exact moment the balancer picks it for a new request, and the client gets a 502 Bad Gateway for no reason anyone can reproduce. The rule is that the backend's idle timeout must be longer than the balancer's. The canonical pairing is an ALB at 60 seconds in front of NGINX at 75. There's a related layering for request timeouts: if the balancer gives up at 30 seconds while the backend is happy to work for 60, the balancer returns a 504 and the backend keeps working on a response nobody will read.
- Health checks are traffic. N balancers each probing M backends every few seconds is N × M / interval requests per second of overhead. It's small until it isn't, and a health endpoint that does real work (the deep check above) multiplies it. Managed balancers probe from several nodes and vote, which is good for accuracy and worth remembering when you count.
The balancer's picture of the world is only as good as its probes. Shallow checks lie about the server. Shared-dependency checks lie about the fleet. Symmetric thresholds make servers flap. Deploys that don't drain drop requests.
Section 5 — The sticky problem
The best session is the one the server never keeps.
Some applications keep per-user state on the server: a shopping cart in memory, a half-completed form, a websocket connection with its list of subscriptions. The moment that state lives on server 3, the balancer loses its freedom. User A's next request has to go to server 3 or the cart is gone. The mechanism for guaranteeing that is sticky sessions, or session affinity: the balancer sets a cookie on the first response (SERVERID=3), the client sends it back with every request, and the balancer routes by it. Same user, same server, cart intact. (Balancers can insert their own cookie for this, or key on one your application already sets; the application cookie is nicer when you want the affinity to expire with the login.)
It works, and it costs you three things, slowly.
- Distribution rots. Stickiness overrides every algorithm in Section 2. The heaviest sessions pile up on whichever servers they happened to land on, and your carefully chosen least-connections becomes decorative.
- Failover loses state. Server 3 dies and every session pinned to it evaporates: users logged out, carts emptied, forms reset, at exactly the moment the system is already having a bad day.
- Scaling reshuffles. Adding servers, removing servers, deploying: every topology change re-pins some fraction of users, and never evenly.
There's a fourth cost hiding in the balancer itself. If the balancer keeps the session-to-server mapping in its own memory (HAProxy calls these stick tables), that mapping has to be replicated to its standby partner or a balancer failover re-pins everyone. Cookie-carried routing sidesteps this because the mapping travels with the client.
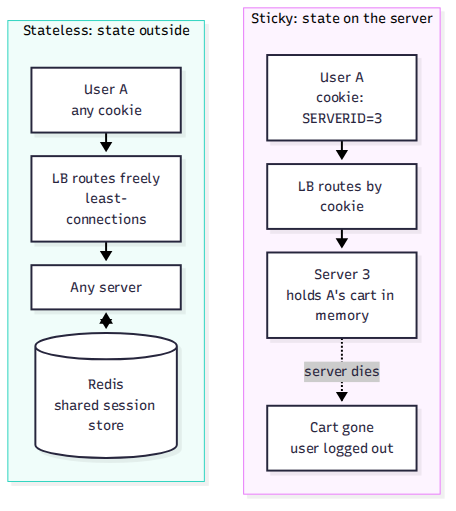
The fix is the one the caching post (#1) already made: move the state out of the server. Sessions go in Redis or the database, every server becomes interchangeable, and the balancer gets its freedom back. The cart survives server 3's death because the cart never lived on server 3. Websockets are the real exception, since a persistent connection is pinned by physics. There you pin deliberately, by IP hash or cookie, and design the reconnect path so the client can reconnect to any server, resubscribe, and have that server rebuild its subscription state from the shared store.
Sticky sessions aren't wrong, exactly; they're a loan. They let you ship stateful servers today and pay in uneven distribution, failover pain, and scaling friction for as long as the system lives. If a design needs stickiness, the first question in review should be what state, and why it can't live outside the server. Usually it can.
Section 6 — The doorman is a box too
The diagram hides something. The load balancer is a server, and servers die. When the box whose job is distributing traffic dies, all the traffic stops, not one-Nth of it. The thing you built to eliminate the single point of failure is now the single point of failure, and every serious load-balancing design starts by admitting it.
The fixes come in layers.
HA pairs. Two balancers, one address. The usual setup is active-passive: the primary holds a floating virtual IP (a VIP: an address that isn't tied to one machine and can be claimed by whichever box is in charge), the standby watches the primary's heartbeat, and when the heartbeat stops the standby claims the IP. On Linux this is usually VRRP (a protocol for passing a shared address between machines) via keepalived, and failover takes a few seconds. In-flight connections drop unless the pair mirrors connection state, which the hardware appliances and some software setups do; new connections flow immediately either way. Active-active is the more capable version. Both balancers serve, with the network splitting connections across them (ECMP, equal-cost multi-path routing, hashes each connection to one of several equally good next hops), and either can die without anyone noticing. It's the replication post's (#5) lesson again: the only real fix for a single box is not needing that box.
Scaling the tier. One HA pair handles a lot, but not an unlimited amount, and the tier scales the same way the app tier did: more balancers, with something in front distributing to them. That something is usually the network itself, through ECMP inside your own network and anycast across the internet. Anycast means the same IP address is announced from many locations, and BGP (the routing protocol the internet's networks use to tell each other which addresses they can reach) delivers each client to the nearest one. The CDN post (#7) took anycast apart in detail; the mechanism and the reason are the same here.
There's a catch in "let ECMP spread connections across N balancers," and the hyperscalers all hit it. ECMP hashes each packet's addresses to pick a balancer. Add or remove a balancer and the hash function's output changes for a large fraction of flows, so packets from an existing connection start arriving at a balancer that has never seen it, which resets the connection. The fix is a stateless L4 tier where every balancer uses the same consistent hash to pick the backend, plus a local table of flows it has seen, so any balancer receiving any packet routes it to the same backend. Google's Maglev (published 2016), Meta's Katran (built on XDP/eBPF, which lets a program run inside the Linux kernel's network path), Cloudflare's Unimog, and GitHub's GLB are all versions of this idea, and they typically use DSR from Section 3 so the balancers only carry the inbound half. You probably won't build one. It helps to know why they exist when the cloud balancer's documentation starts talking about connection draining on scale-in.
Global load balancing is the same idea at planetary scale, with two mechanisms and different trade-offs:
- DNS-based. A geo-aware DNS server answers "where is api.example.com?" with the address of the nearest healthy region: Virginia for New York clients, Frankfurt for Berlin. It's simple and needs no special network. But DNS answers get cached (Section 1's problem again, now worldwide), so failover means waiting for TTLs to expire across every resolver on earth. Minutes, not seconds, and some clients pin the first IP they got and never re-resolve at all. And "nearest" is approximate, because DNS sees where the resolver is, not where the client is; the EDNS Client Subnet extension (RFC 7871) lets resolvers pass along part of the client's address to fix this, and some of the big public resolvers do (Google's and OpenDNS's) while the privacy-focused ones don't (Cloudflare's 1.1.1.1, and Quad9 by default).
- Anycast. One IP, announced from every region, and BGP does the rest. Failover is a routing change, so there are no caches to wait out. Inside your own network that converges in seconds; on the public internet, tens of seconds to a couple of minutes, and a route change can break long-lived TCP connections mid-flight. This used to require your own address space and BGP relationships, which kept it a big-operator tool. It's now something you can buy: AWS Global Accelerator, Google's global load balancer, and Cloudflare all put anycast in front of ordinary origins.
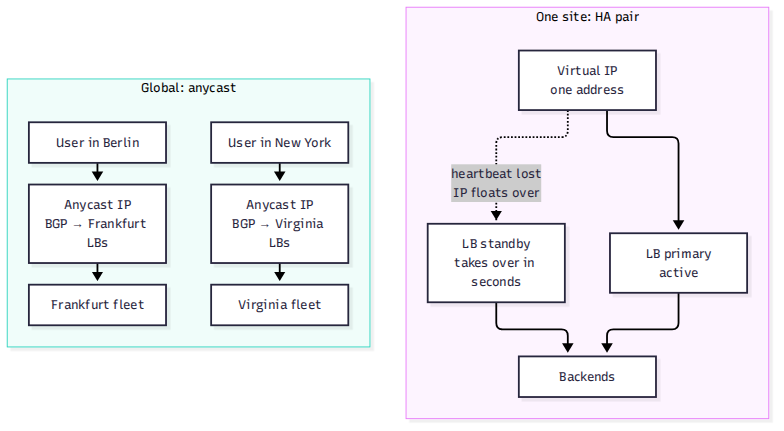
Geo-routing, sending EU users to EU servers, is where this meets the CDN post's edge: same anycast, same points of presence, same physics. And the same caveat: geography is a routing input, not a guarantee. BGP decides "nearest" by path cost rather than kilometers, and paths change.
One level down from regions, cloud balancers are zonal. A cloud balancer is a fleet of nodes spread across the availability zones you enabled, and the Layer 4 kind (AWS's NLB) by default sends traffic only to backends in the same zone as the node that received it; cross-zone balancing evens things out at the cost of cross-zone bandwidth charges and a millisecond or two of latency (the ALB, AWS's Layer 7 balancer, always balances across zones and doesn't charge for it), and the trade shows up in a specific way: if one zone dies, do the survivors have the headroom to absorb its share? Section 7 does that arithmetic.
A question worth asking in any design review: what balances your load balancer? If the answer is "nothing, it's one box," that's fine for a side project and a known risk for anything else. Better to name it than discover it.
Section 7 — When the doorman makes it worse
The balancer did its job perfectly. That was the problem.
Ten servers. One dies at peak, a real hardware failure. The health checks catch it within seconds, pull it, and redistribute its share across the nine survivors. Each survivor now carries about 11% more than it did. They were at 85% utilization; now they're at 94%. Latency climbs, timeouts start, and the passive checks see the timeouts and conclude that a second server is unhealthy. Out it goes. Its load spreads across eight, which puts each of them past 100%. Queues explode. The balancer pulls a third. It is faithfully, correctly, and algorithmically killing the fleet one server at a time, and by the time a person intervenes, "one server died" has become "everything is down." This is cascading failure, and the balancer is what transmits it.
The arithmetic underneath is worth having in your head, because it tells you how much headroom to buy. If you want to survive losing k of N servers, the survivors have to absorb the whole load, so your normal utilization can't be above (N − k) / N. Ten servers at 85% can lose one (survivors at 94%) but not two (survivors at 106%). Ten servers at 70% can lose two and still be under 90%. The resilience post (#2) makes the same point from the other side, and Section 9 of the estimation post (#13) turns it into a purchase order.
Three more ways the balancer can cause the outage it exists to prevent:
Thundering herd on failover. The dead server's traffic doesn't trickle over to the survivors; it lands all at once, mid-peak. The mirror-image problem is a server joining cold: empty caches, an unwarmed JIT (the just-in-time compiler that managed runtimes use to speed up hot code after it has run a while), and a full share of traffic from the first second. The fix for the cold-join problem is slow start. A rejoined or newly added server gets a trickle first, something like 5% of its share ramping to full over a minute, so caches fill and the runtime settles before the flood. Envoy supports it (slow_start_config), HAProxy has slowstart, AWS's ALB has a slow-start setting, and NGINX has had it in open source only since 1.29.6 (March 2026); before that it was a commercial NGINX Plus feature. It's a few lines of configuration and it has saved more fleets than any algorithm choice.
Retry amplification. The client makes up to three attempts. The balancer retries a failed backend attempt on another server, so up to two attempts per client attempt. The server's own database client makes two attempts. One user action becomes 3 × 2 × 2 = 12 database operations, during an incident, when everything is already saturated. (Google's SRE book uses a nastier version of this: three layers each allowing three retries is 4 × 4 × 4 = 64 attempts per user action.) This is the resilience post's retry problem, and the balancer is one of the layers doing the multiplying. The fix is retry budgets at every layer, the balancer included: each layer gets a capped percentage of its traffic as retries rather than a per-request multiplier. Envoy's retry budget, once you enable it, is 20% with a floor of three concurrent retries; Google's guidance is a 10% per-client budget. Two safety rules travel with this: the balancer should only retry on connection failures and on idempotent methods (ones safe to repeat, like GET and PUT; never a blind POST; post #6 is about why), and each attempt needs its own per-try timeout so the retries don't stack into one enormous wait.
Stale weights. The new 64-core boxes were supposed to get weight 4, someone left them at 1, and they idle while the old boxes melt. Or a canary weight of 5% never gets removed, and six months later 5% of production is running an unmaintained build. Weights are configuration, configuration rots, and the balancer obeys rotten configuration perfectly.

The defenses come as a set. Cap how much of the fleet the balancer may eject at once: Envoy's outlier detection defaults to a maximum of 10% of a pool, and the cap is the important part, because a balancer that can fire everybody eventually will. Keep the panic threshold from Section 4, so that a pool that looks entirely unhealthy gets traffic anyway. Slow-start rejoined servers. Budget retries per layer. Add jitter to client reconnects so a balancer failover doesn't produce a synchronized reconnect storm. Audit weights the way you'd audit firewall rules. Underneath all of them is one idea: the balancer is a control loop, and a control loop without damping will oscillate the system to death.
Section 8 — The control plane
Step back and notice what the balancer sees: every request, every response code, every latency, every backend's health. The whole system's vital signs, in one place, in real time. No other component has that view, which makes the balancer more than a distributor. It's the one component positioned to steer. Deploys and disasters both run through it. (People call this the control plane: the part of a system that decides where traffic goes, as opposed to the data plane, which carries it. The balancer straddles both.)
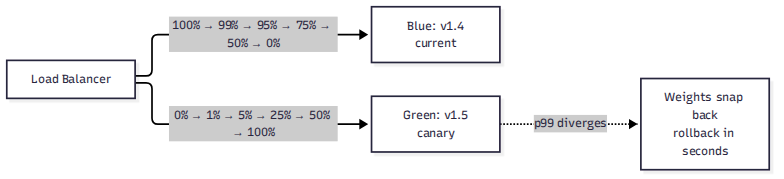
Blue-green and canary deploys are weights. Two fleets, blue running the current version and green running the new one. A blue-green deploy flips the balancer from 100% blue to 100% green in one configuration change; rollback is flipping it back, and the price is that nobody gets gradual exposure. A canary is the careful version, and it's just weighted round-robin on a schedule: 1% to green for an hour while you watch the error rate, then 5%, then 25%, 50%, 100%. The balancer's weights are the deploy tool and its metrics are the safety signal. If green's p99 latency (the latency that 99% of requests come in under, which is where problems show up first) diverges from blue's, the weights go back before most users notice. Two refinements worth knowing: you can target the canary by header or cookie instead of by percentage, so employees see the new version first; and traffic mirroring (Envoy's request mirror policy, NGINX's mirror) copies live requests to the new version and throws away its responses, so you can watch it handle real traffic with zero user exposure. Mirroring only works for requests without side effects, or the new version will place real orders twice. Since the deploy strategy is literally a load-balancing configuration, treat it like one: versioned, reviewed, and rolled back automatically.
Shedding at the front door. The balancer watches backend queue depth, and when it crosses a line, it stops queueing and starts refusing, quickly.
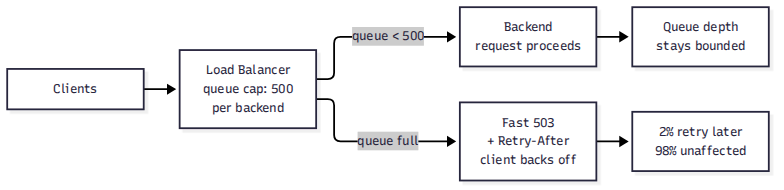
When the backends saturate, somebody has to say no, and the balancer is the best somebody. It sits in front of the overloaded servers, it sees the whole picture, and saying no there costs almost nothing. The mechanisms are simple: cap concurrent connections per backend, so the excess gets a fast 503 instead of a slow timeout; cap the queue, so requests beyond N are rejected immediately (a fast no beats a slow yes that was going to time out anyway); and send a Retry-After header so well-behaved clients back off instead of hammering. The status code matters: 503 means we are overloaded, 429 means you exceeded your limit, and the rate-limiting post (#8) is about the second one. If requests carry a priority or criticality header, the balancer can shed the cheap ones first, which the resilience post calls admission control; this is admission control located at the front door. One way or another the balancer decides how the system behaves under overload. It can do that deliberately, in configuration, or accidentally, in collapse.
The shape this usually takes is a flash sale. Backends saturate, no shedding is configured, and the balancer keeps accepting connections and queueing them, tens of thousands deep, until every client times out and retries, which doubles the queue. The site is technically up (connections accepted!) and completely failing (nothing completes). The fix is one setting: cap the queue at a few hundred per backend and return 503 past that. The next sale is boring. A couple of percent of shoppers see "try again in a moment," everyone else checks out, and that's the whole difference between everyone suffering and a few people retrying.
Since the balancer sees everything, it's also the natural place to stamp each request with an ID and write the access log. A request ID injected at the front door and passed down through every service is what makes a trace possible later (post #9), and the balancer's access log is often the only complete record of what clients actually sent.
Section 9 — Going deep: the principal-level toolkit
You've picked the least-loaded server. Why is it still the slow one?
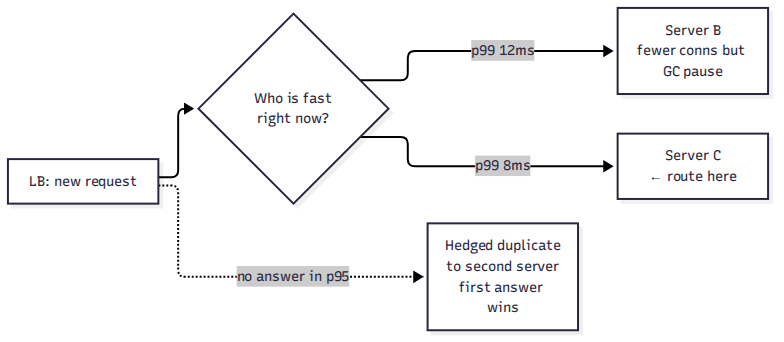
Because load isn't latency. The server with 3 connections might be in the middle of a four-second garbage-collection pause; the one with 42 might be chewing through trivial cache hits at 2 ms each. Least connections routes around busyness and knows nothing about speed. In a system where the p99 is the promise, speed is what matters.
Latency-aware routing is the answer: route by observed latency rather than connection count. Track each backend's recent response-time distribution (the EWMA from Section 2, or a small reservoir of recent samples) and prefer the backends whose tail is short right now. A server sliding into GC pauses gets quietly avoided until it recovers. No threshold crossed, no ejection, just fewer requests at exactly the moment it needs fewer. The named implementations are mostly client-side: Finagle and Linkerd's "peak EWMA" combined with power of two choices, Envoy's least_request with its active-request bias, NGINX's least_time (open source since 1.31.0). Central balancers mostly don't do this, which is one of the reasons the client-side approaches below exist. A related trick is to have backends report their own load (CPU, queue depth) in response headers or a side channel, since the server knows it's in trouble before the balancer's samples do; Envoy calls this ORCA, and it's what Google's balancers have done for years.
The subtler version is hedged requests, which the resilience post introduced: send the request to one server, and if it hasn't answered within the p95 time, send a duplicate to a second server and take whichever answers first. You're not predicting which server will be slow; you're declining to wait for it. The cost is the duplicated work, which stays bounded because you only hedge the tail (Dean and Barroso's "The Tail at Scale" paper hedges at the 95th percentile, adding about 5% load, and reports a Bigtable case where hedging after a fixed 10 ms cut the 99.9th percentile from 1,800 ms to 74 ms for 2% extra requests). The payoff is a p99 that stops caring about any individual server's bad minute.
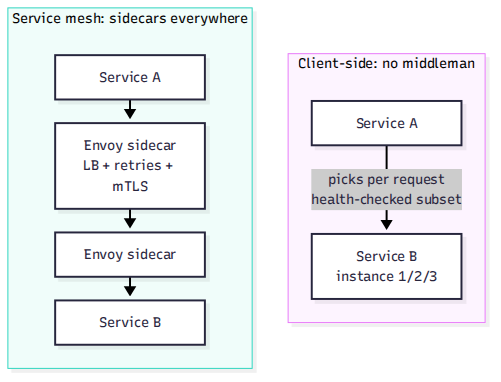
Client-side load balancing removes the middleman. Instead of a box at the front door, each client holds the list of servers and picks one per request. This is the gRPC model: no extra hop, no single box to scale, no added latency, with the client library doing the health checking, retries, and weighted choice itself. The prices: every client has to be smart, library upgrades roll out slowly, the service-discovery system that feeds clients the server list becomes a critical dependency, and every client opens connections to every server, which is N × M connections across the system. (A buggy picker in one service only poisons that one service, which is a cost and a benefit at the same time.) It works well inside the system, service to service, where you control the clients. It doesn't work at the edge, where the clients are browsers and phones you don't.
The N × M problem has a standard answer called subsetting, from the Google SRE book: each client connects to a fixed-size subset of the backends rather than all of them, chosen deterministically so that every backend ends up with roughly the same number of clients. Too small a subset and one client can't spread its load; too large and you're back to N × M. The book's deterministic subsetting algorithm is a few dozen lines and worth reading once. This is also where the herding caveat from Section 2 gets resolved: with many independent balancers or clients each picking "the emptiest server," they all pick the same one at the same instant. Power of two choices, or a small random subset per client, breaks the synchronization.
Service meshes are client-side balancing packaged as infrastructure. A sidecar proxy (usually Envoy) sits beside every service instance (in Kubernetes, a second container in the same pod) and does everything Sections 2 through 8 describe: least connections, health checks, outlier ejection, retries with budgets, canary weights, and mutual TLS (mTLS, where both sides of every connection present certificates), all configured centrally and executed locally. What a mesh really does is move the load-balancing logic out of a central box and into every pod. That buys you per-service policy and removes the central bottleneck, at the cost of running and configuring a distributed system to manage your distributed system, plus a proxy hop per call. The newer "proxyless" designs (gRPC clients that speak the mesh's xDS configuration protocol directly, and Istio's sidecar-less ambient mode, which runs one proxy per node plus optional waypoint proxies) are attempts to keep the central policy without the per-pod sidecar tax. My rule: adopt a mesh when you have dozens of services that need different policies. Until then the central balancer is simpler, and the simplicity is the point.
Sizing the tier itself. The balancer is infrastructure with its own ceiling, and someone has to do the math:
- A single software balancer (NGINX, HAProxy, Envoy) on a serious machine pushes tens of gigabits, up to around 100 Gbps with a 100 GbE card, and holds on the order of a million concurrent connections. HAProxy has published 2 million HTTPS requests per second and 92 Gbps on one 64-core cloud instance. The spread is wide because it depends on TLS (termination is the expensive part; passthrough is nearly free) and on how much L7 parsing you do. Treat these as order-of-magnitude numbers and measure your own.
- The binding constraints are usually CPU, because every new connection costs a TLS handshake (session resumption and keep-alives are how you make that affordable), and then a set of limits that surprise people because they aren't about bandwidth at all: the file descriptor limit (every connection is one), the kernel's connection-tracking table if the firewall (netfilter) or address translation (NAT) is in the path (when it fills, new connections drop and the kernel logs
nf_conntrack: table full), and for a full proxy, ephemeral ports. A proxy opening connections to a backend has roughly 28,000 to 64,000 source ports per source IP to that backend's address, and a busy proxy can exhaust them; the fixes are keep-alive pools to backends, HTTP/2 to backends, and multiple source IPs. - When one pair isn't enough, add pairs, front them with ECMP or anycast, and let the network distribute to the distributors. The recursion bottoms out at BGP, which is the internet's own load balancer and scales fine, with the convergence caveats from Section 6.
- Cloud balancers bill in capacity units (an ALB's LCU counts new connections, active connections, bandwidth, and rule evaluations, and charges for the largest), so "how big" is also a line item; the estimation post (#13) is where that arithmetic lives.
- And because the balancer sees every request, it's the cheapest place to measure. Request rates, error rates, latency histograms per backend: export all of it. The component that steers should also be the one that reports.
One last way to look at it. Beginners think the load balancer distributes traffic, but what it actually distributes is fate: which server's bad minute becomes whose bad experience, whether one dead box stays one dead box, whether overload is shared across everyone or shed from a few. Every section of this post was a version of that decision. It deserves to be designed like it matters, because when it fails, it's the only box whose failure is total.
The traffic cop, distilled
For the skimmers and the revisitors: everything above, on one page.
Key numbers:
| Active health-check defaults | 2–30 s intervals, 2–3 failures to eject, depending on the product (NGINX's passive default is 1); set them, don't inherit them |
| Hysteresis bar for rejoining | Higher than ejection: ~10 clean probes or 60 s clean (several defaults do the opposite; ALB's 2/5 doesn't) |
| Envoy panic threshold | Below 50% healthy, ignore health and send to everyone |
| Connection drain on deploy | Stop new, wait for in-flight: 30 s (Kubernetes) to 300 s (ALB default) |
| Idle-timeout rule | Backend keep-alive timeout > balancer idle timeout, or you get random 502s (ALB 60 s / NGINX 75 s) |
| Headroom to survive k of N | Normal utilization ≤ (N − k) / N |
| Canary weight schedule | 1% → 5% → 25% → 50% → 100%, watching metrics at each step |
| Power of two choices | Best of 2 random ≈ global least-loaded, exponentially better than 1 random |
| Hedged requests | Duplicate only the tail (slowest ~1–5%), take the first answer |
| One software LB's ceiling | Tens of Gbps up to ~100, on the order of a million connections; TLS termination is the expensive part |
| Retry budgets | Envoy 20% (min 3) once enabled, Google 10% per client, at every layer |
| Outlier ejection cap | Envoy default: at most 10% of the pool ejected at once |
| DNS failover speed | Minutes (TTL-bound); anycast failover is a routing change: seconds inside your network, longer on the public internet |
Every trade-off, in one table:
| Decision | Chose | Over | Why |
|---|---|---|---|
| Distributing | A load balancer | DNS round-robin | DNS caches, distributes unevenly, and keeps hammering dead servers |
| Default algorithm | Least connections | Round-robin | RR ignores what the requests cost; least-conn looks at the servers |
| Unequal servers | Weighted round-robin | Equal rotation | Big boxes should get more, but audit the weights, they rot |
| Cheap affinity | IP hash | Cookie infrastructure | No state needed, but rescaling reshuffles everyone and NAT breaks it |
| Balance without global state | Power of two choices | Pure random | Two samples get you exponentially better balance for nearly free |
| Cache affinity | Consistent hashing | Any stateless algorithm | Same request → same server keeps hit ratios alive; survives rescaling |
| Protocol handling | L4 | L7 | Faster, cheaper, protocol-blind, when backends are interchangeable |
| Content routing | L7 | L4 | Host/path/header/cookie routing; pays the TLS-termination tax |
| Client identity | Trust only your own hop's X-Forwarded-For / PROXY protocol |
Trusting the header | Clients can write any value into the header |
| TLS | Terminate and re-encrypt, or passthrough with SNI | Plaintext inside | Keys and decrypted traffic are a compliance boundary |
| Health checking | Active + passive checks | One kind | Active probes proactively; passive reacts to real user pain |
| Health endpoint | Checks this server's own state | Shared-dependency checks that fail everywhere at once | A shared-dependency check ejects the whole fleet on a blip |
| Flapping | Hysteresis (hard out, harder in) | Symmetric thresholds | Oscillating servers reshuffle the fleet on every flap |
| Deploys | Connection draining | Kill and restart | In-flight requests finish; no deploy-shaped 500 spikes |
| Server state | Externalize (Redis/DB) | Sticky sessions | Stickiness rots distribution, loses state on failover, fights scaling |
| The balancer's own death | HA pair / anycast tier | One box | The anti-SPOF (single point of failure) must not be an SPOF |
| Global routing | Anycast | Geo-DNS | Failover in tens of seconds to minutes with no client changes; costs BGP complexity |
| Rejoining servers | Slow start | Full traffic instantly | Cold caches + cold JITs + full flood = instant re-death |
| Retry policy | Budgets per layer, idempotent only | Multipliers per layer | Retries multiply across layers; cap the product |
| Deploys via balancer | Canary weights, mirroring | Big-bang flip | 1% exposure with metrics beats 100% hope; blue-green for instant rollback |
| Overload | Shed at the balancer (fast 503) | Queue until collapse | A fast no beats a slow yes; 2% retrying beats 100% timing out |
| Tail latency | Route by observed latency / hedge | Least-connections alone | Load isn't speed; refuse to wait for the slow server |
| Service-to-service | Client-side (gRPC) or mesh sidecars, with subsetting | Central balancer per hop | No extra hop, per-service policy, where you control the clients |
| Sizing the tier | Measured: Gbps, connections, ports, TLS handshakes | Guesswork | The tier has a ceiling; front it with ECMP/anycast past it |
Three ideas to take with you:
- The load balancer distributes fate, not traffic. Which server's bad minute becomes whose outage, whether one dead box stays one dead box, whether overload is shared or shed: every section was this decision in a different form.
- Every control loop needs damping. Hysteresis on health checks, ejection caps and a panic threshold, slow start on rejoin, retry budgets. The balancer is a feedback loop, and undamped feedback loops oscillate systems to death.
- The balancer is the cheapest place to steer and to see. Deploys, canaries, shedding, request IDs, and the system's vital signs all live at the front door. Instrument it, configure it deliberately, and never let it be one box.
Further reading
- NGINX: HTTP load balancing. The practical reference for weighted round-robin, least connections, IP hash and health checks; note that active health checks are still an NGINX Plus feature (open-source NGINX has only passive
max_fails), and slow start only joined open source in 1.29.6. Behind Sections 2, 4, and 7. - HAProxy documentation. The other canonical software balancer; its algorithms, stick tables,
slowstart, and health-check model are the reference implementation of Sections 2–5 and 7. - Google SRE Book: Load Balancing at the Frontend. DNS-based and VIP-based global balancing; behind Section 6.
- Google SRE Book: Load Balancing in the Datacenter. Subsetting and the client-side thinking behind Section 9.
- Amazon Builders' Library: Implementing health checks. The best treatment of the dependency-check trap in Section 4.
- Maglev: A Fast and Reliable Software Network Load Balancer (NSDI 2016). The stateless L4 design behind Section 6's hyperscale paragraph.
- Envoy: Outlier detection and Panic threshold. The ejection caps and fail-open rule from Sections 4 and 7, as shipped.
- Dean & Barroso: The Tail at Scale (CACM 2013). Hedged requests and why tails compound; behind Section 9.
- AWS: Elastic Load Balancing documentation. ALB (L7) vs NLB (L4) is Section 3 as a purchasing decision, with target-group health checks and deregistration delay as Section 4.
- Designing Data-Intensive Applications: Martin Kleppmann. The replication and partitioning chapters touch the consistent-hashing and request-routing ideas throughout.
Where you'll meet this
This post is the expanded version of the box the URL shortener interview drew in Step 3 and never explained. It was also hiding inside the resilience post (#2): outlier ejection (the balancer's version of a circuit breaker), retry budgets, and admission control are Sections 7 and 8 of this post seen from the application's side, and hedged requests started there. The sharding post's (#3) consistent hashing came back as the cache-affinity algorithm in Section 2. The CDN post's (#7) anycast is Section 6 at planetary scale. The rate-limiting post's (#8) Retry-After is what the balancer attaches to the 503 it sends when it sheds load in Section 8 (the 429 is the rate limiter's own verdict), and its per-IP limits are why Section 3 cares so much about X-Forwarded-For. The observability post (#9) is where the balancer's metrics and request IDs end up. Next up is security and abuse (#12), because the traffic cop also has to notice the pickpockets.
Keep exploring: the Core Concepts series
Every post in the series stands alone. Read them in any order.
- From Laptop to Billions of Clicks: Designing a URL Shortener in 11 Steps — the anchor: one design, every concept under load.
- #1 The 100:1 Superpower: Caching — the fastest request is the one you never make.
- #2 The Blast Radius: Surviving the Day Your Dependencies Fail — staying up when everything you depend on goes down.
- #3 Divide and Conquer: Sharding and Partitioning — splitting one database into many without losing your mind.
- #4 The Snowflake Problem: Unique IDs at Scale — naming things when millions are born every second.
- #5 Copies of the Truth: Replication — keeping copies of your data that actually agree.
- #6 Do No Harm Twice: Idempotency — making "just retry it" safe.
- #7 The Copy at the Doorstep: CDNs and Edge Computing — serving from next door instead of across the ocean.
- #8 The Bouncer's Math: Rate Limiting — saying no politely, at scale.
- #9 What Broke at 3 AM: Observability, p99, and Useful Alerts — knowing what's wrong before your users tell you.
- #10 Do It Later, On Purpose: Async Processing and Queues — the work the user doesn't have to wait for.
- #11 The Traffic Cop: Load Balancing — the box in every diagram nobody explains. (this post)
- #12 Assume They're Already Knocking: Security and Abuse at Scale — designing for the users who are designing against you.
- #13 Do the Math First: Estimation for System Design — the two minutes of arithmetic that choose the architecture.
- #14 The Whiteboard Playbook: Taking On Any System Design Challenge — the whole series in forty-five minutes.
Blueprints of Scale — Core Concepts #11. If this helped, the best thanks is a share with someone who's learning.